

Navigating and Optimizing the GA4 Dashboard: Best Practices for 2024
Google Analytics 4 (GA4) represents a significant shift from its predecessor, Universal Analytics (UA), focusing on a more nuanced and privacy-conscious approach to tracking and analyzing user interactions. Navigating the GA4 dashboard can be overwhelming, with endless data points and default reports that may not align with your specific business needs. But it doesn’t have to be. Customizing GA4 can simplify the process, helping you quickly find the insights that matter most.
This guide is here to help you navigate and optimize the GA4 dashboard, ensuring you can tailor it to your unique business goals, saving time, and uncovering actionable insights. If you’re new to analytics, consider checking out the beginner resources linked below before diving in.
The Basics of Navigating GA4
Navigating the GA4 dashboard can be overwhelming, especially when you know there are valuable insights buried somewhere in the data, but you just can’t seem to find them. It’s like having all the pieces to a puzzle but struggling to put them together in a way that makes sense. But don’t worry—you’re not alone, and the good news is that with a little guidance, you can unlock the full potential of GA4 and make it work for you.
Log in and Select the Correct Property
Before diving into the dashboard, ensure you’re logged into the correct GA4 account and viewing the right property. This step can save you a lot of headaches later on. Once you’re in, you’ll notice that GA4’s navigation menu is located on the left-hand side of the screen. The menu is represented by icons, which you can see in full by hovering over them.
Overview of the GA4 Dashboard Layout
Now that you’re in the right place, let’s get familiar with the dashboard’s layout:
Home
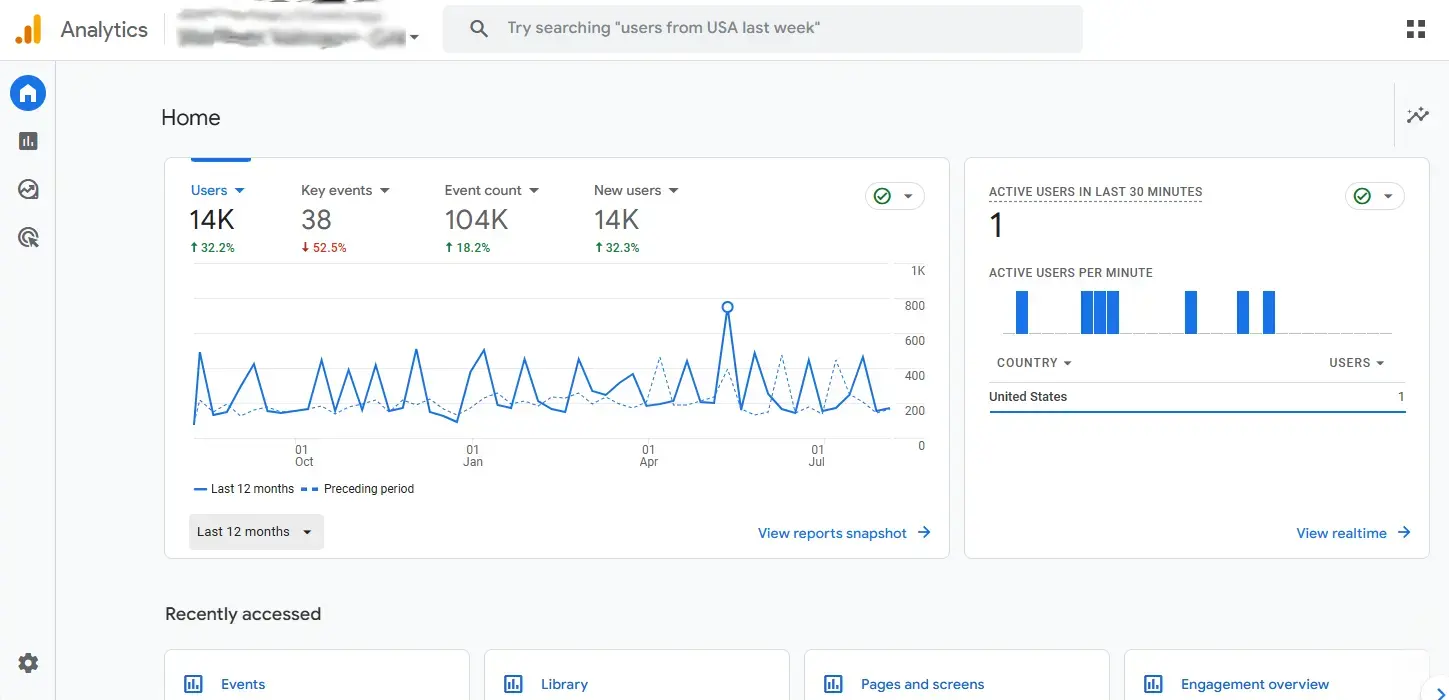
The Home section is your starting point, a command center where you can get an overview of your data at a glance. It helps you quickly identify trends and patterns, providing a broad snapshot of what’s happening across your website or app. While it may not give you all the details, it’s a great launch pad for deeper analysis.
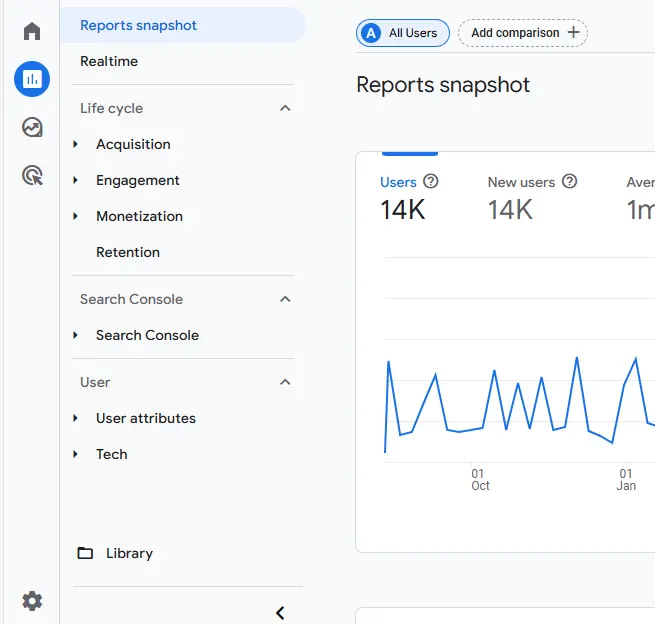
Reports
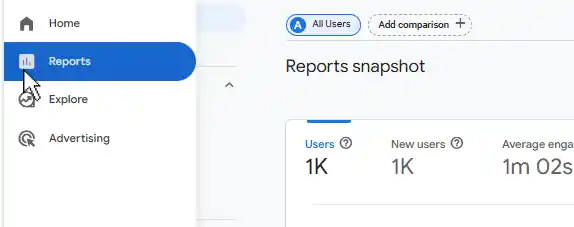
This is where the bulk of your data analysis will happen. The Reports section, accessible by clicking on the bar chart icon, houses both overview and detailed reports that cover key areas such as user acquisition, engagement, monetization, and more. This section is the heart of GA4, and understanding how to navigate it is crucial for finding the insights you need.
Explore
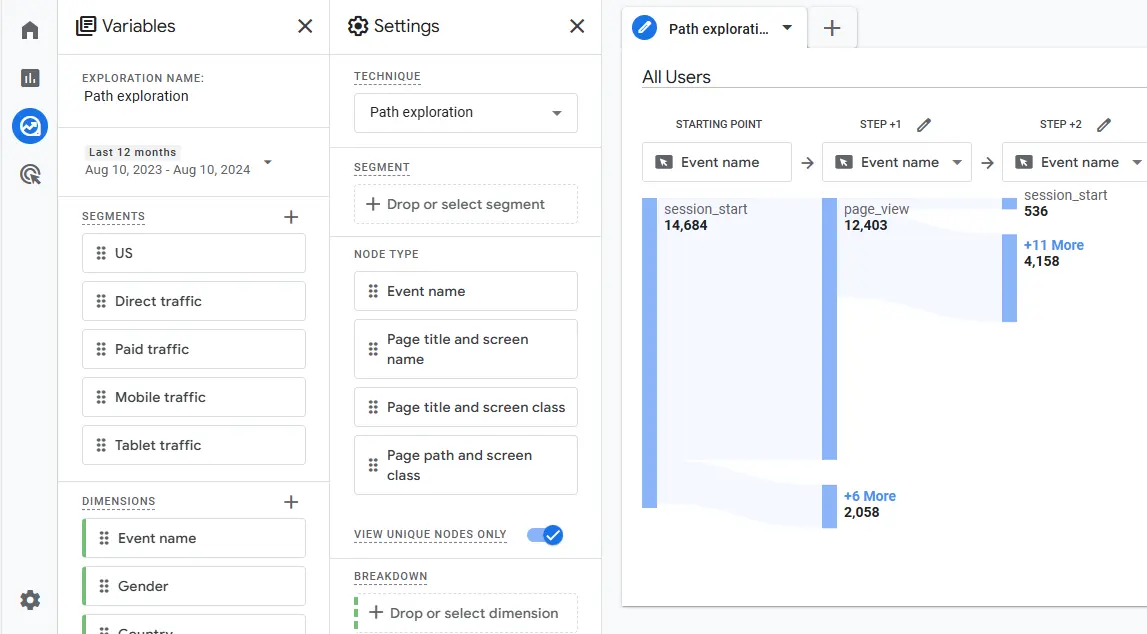
If you’re looking to go beyond the default reports, the Explore section is where you can get creative. Here, you can build custom explorations tailored to specific questions or needs. The best part? You can save these exploration reports, making it easy to revisit them whenever you need that data. It’s like having a mini version of Looker Studio built right into GA4, giving you the flexibility to pull and analyze data as frequently as you need.
Advertising
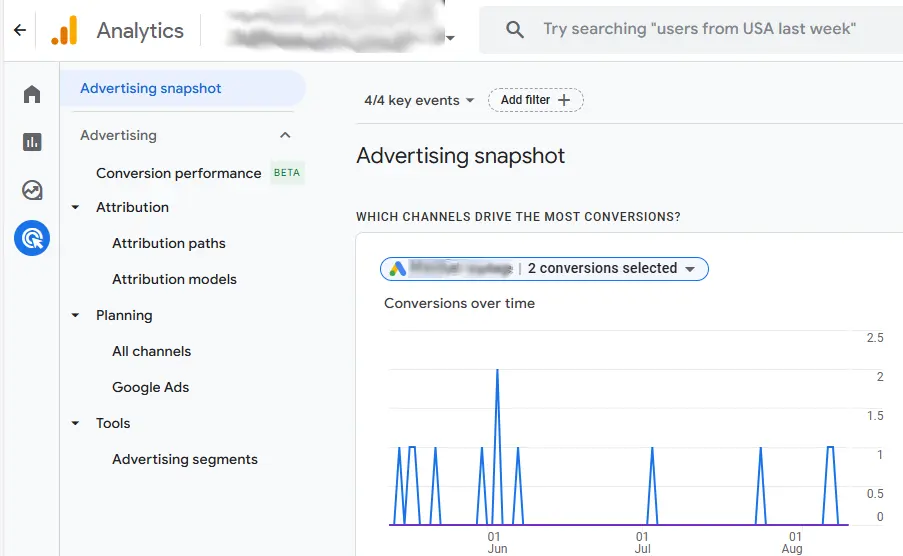
For those running ad campaigns, the Advertising section provides insights into your ad performance. Here, you can track your return on investment and see how your ads are influencing user behavior on your site or app. It’s an essential tool for understanding the impact of your marketing efforts.
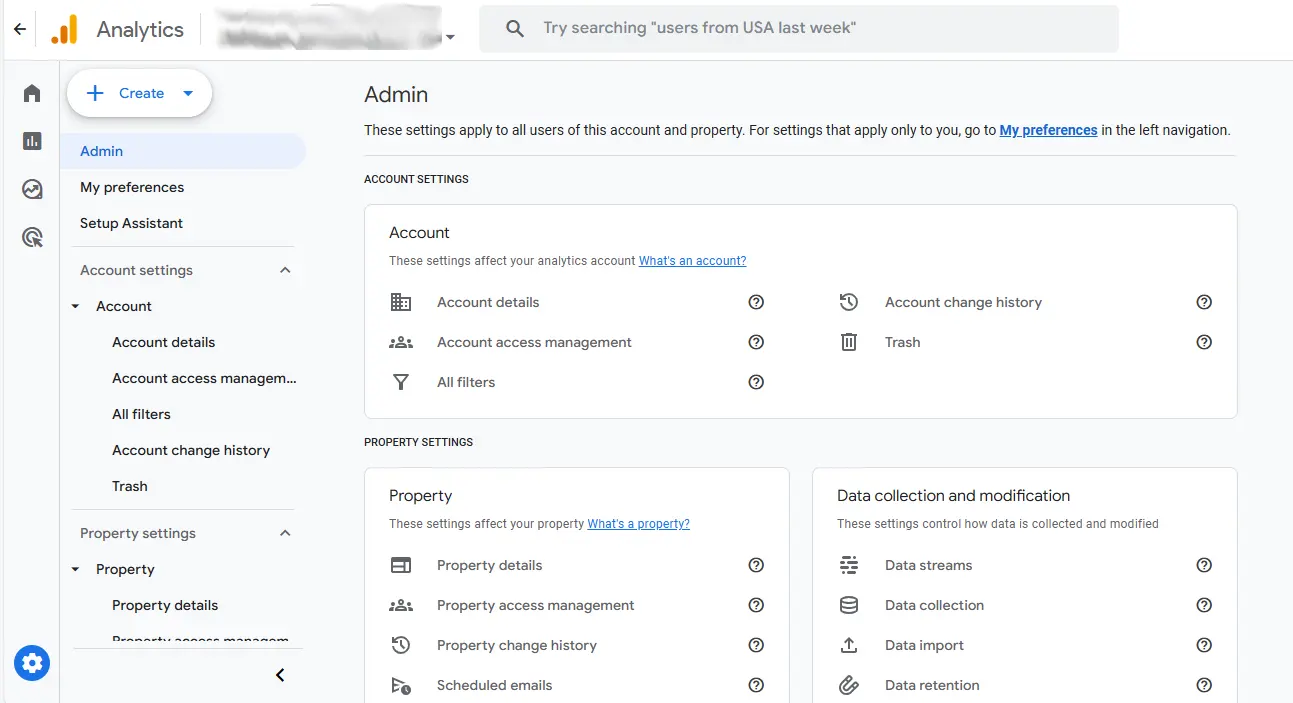
Admin (formerly Configure)
Lower down in the menu, represented by a gear icon, is the Admin section. This is where you’ll set up your tracking, manage events, and customize your GA4 settings. Here you can add events to track, set events as ‘key events’ (formerly conversions in GA4 and Goals in UA), and so much more. Think of this as the backend of your analytics setup, ensuring that the data you collect is accurate and aligned with your business objectives.
Introduction to Default Reports
Once you’re comfortable with the layout, it’s time to dive into the default reports that GA4 provides right out of the box. These pre-built reports are an excellent starting point, offering a broad overview of your data.
Pre-built Reports Available Out of the Box:
GA4 comes equipped with a variety of reports designed to give you an immediate snapshot of your website or app’s performance. These include reports on user acquisition, behavior, engagement, and more. While they might not cover every specific need, they’re incredibly useful for getting a quick read on key metrics.
Before you start customizing, it’s essential to understand what the default reports offer. They provide a baseline that helps you identify which areas need more detailed exploration and where customization might be beneficial. By knowing what’s already available, you can avoid duplicating efforts and instead focus on enhancing the reports that matter most to you.
Customizing GA4 Reports
GA4 is a powerful tool, but its true potential is unlocked when you tailor it to your specific needs. By customizing your dashboard, you can align GA4 with your business goals and ensure that the metrics you see are the ones that matter most. Instead of getting lost in a sea of irrelevant data, customization allows you to focus on the insights that drive real decision-making This makes your analytics experience more efficient and impactful.
How to Customize Pre-Existing Reports
Customizing GA4’s pre-existing reports allows you to align the dashboard with your unique business needs, ensuring you focus on the metrics that truly matter. Here’s a step-by-step guide to accessing and modifying these reports, along with some tips on making the most out of GA4’s customization features. While this section focuses on editing existing reports, it’s worth noting that GA4 also allows you to create entirely new reports and collections using the Library feature, which we’ll discuss in more detail later.
Step-by-Step: Accessing and Modifying Reports
Accessing a Report:
Navigate to the Reports section on the left-hand menu. Here, you’ll find both overview and detailed reports covering various aspects like user acquisition, engagement, and more.
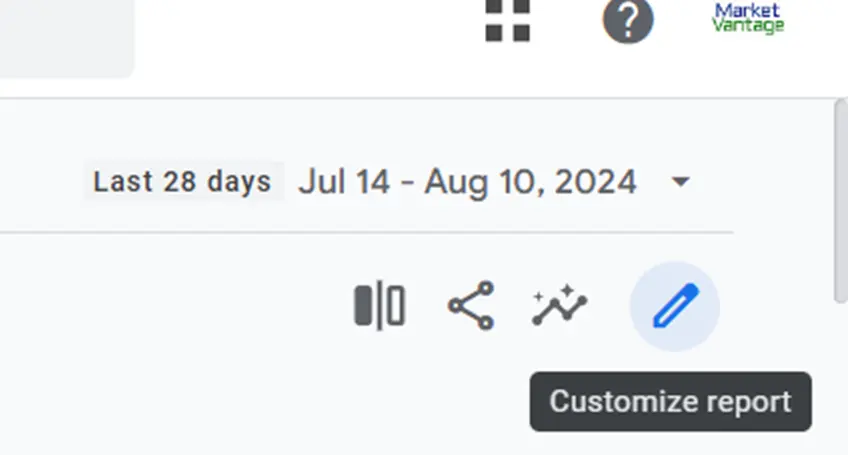
Modifying a Report:
To customize a report, click the pencil icon in the top-right corner of the report. This will open up the report editor, allowing you to make adjustments to the existing report.
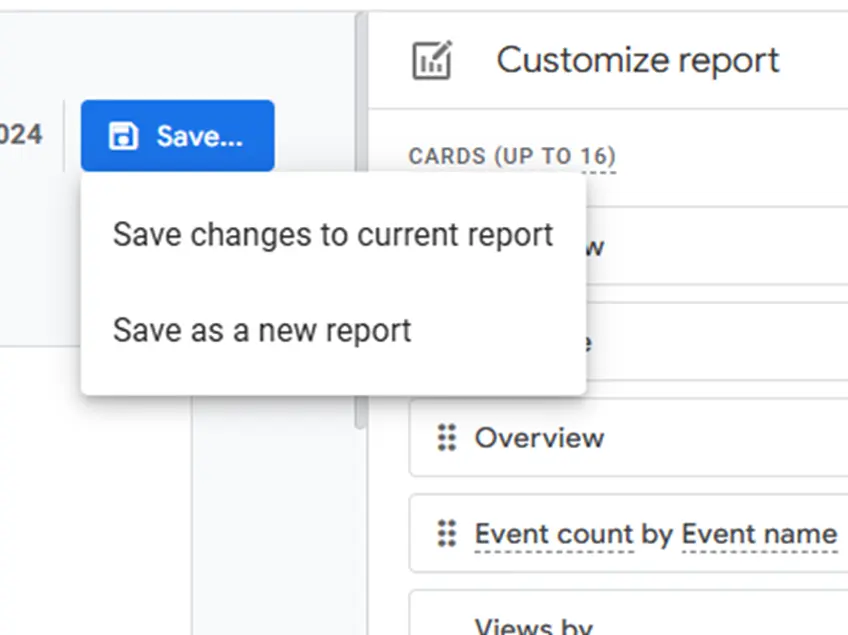
You can modify the report by changing the metrics, dimensions, or visualizations. Once you’re satisfied with the changes, you have two options: Save to update the current report or Save As to create a new report with your modifications.
Explore
If you’re looking to go beyond the default reports, the Explore section is where you can get creative. Here, you can build custom explorations tailored to specific questions or needs. The best part? You can save these exploration reports, making it easy to revisit them whenever you need that data. It’s like having a mini version of Looker Studio built right into GA4, giving you the flexibility to pull and analyze data as frequently as you need.
Understanding Linked Templates:
When editing a report, you’ll notice that some reports are based on linked templates, such as the Events template when editing an events report. These templates are reusable across multiple reports, meaning changes you make to a template can affect other reports that use the same template.
If you want to make changes to a specific report without affecting others, you can unlink the template during editing. This ensures that your modifications apply only to the current report and won’t echo through other reports that share the same template.
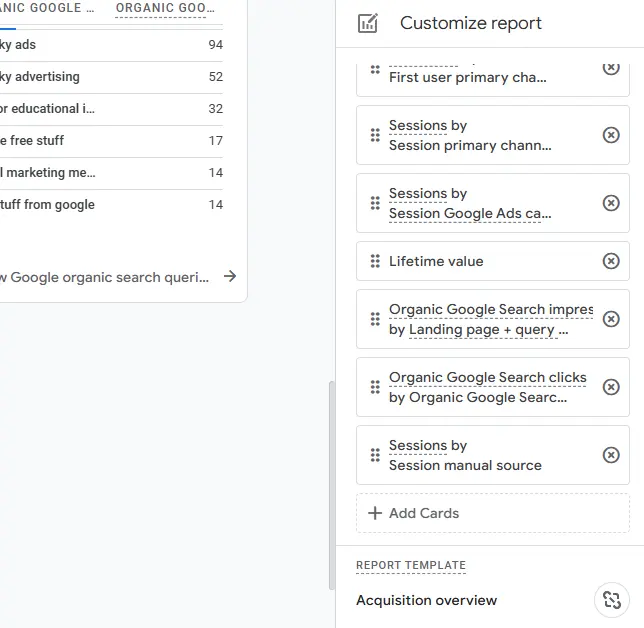
Working with Cards in Reports
In GA4, reports are made up of individual components called cards. Each card represents a specific visualization or data point within the report. Customizing these cards allows you to tailor the report to your needs. Read further on Google’s official documentation on summary cards here.
Adding Cards: To add a new card to a report, click the “+ Create New Card” button. This lets you insert additional metrics or visualizations that are relevant to your analysis.
Editing Cards: Click on the three dots (ellipsis) on an existing card and select “Edit” to adjust its settings. Here, you can modify the data source, visualization type, or any other specific details related to that card.
Removing Cards: If a card is irrelevant to your needs, click the three dots on the card and select “Delete” to remove it from the report.
Reordering Cards: You can also rearrange the cards within a report by simply dragging and dropping them to your preferred order. This helps prioritize the most important data points, putting them front and center.
Overview vs. Detailed Report Types
GA4 allows you to customize both overview reports, which provide a high-level snapshot, and detailed reports, which dive deeper into specific metrics. Understanding the difference helps you decide where to focus your customization efforts.
Overview Reports: Great for getting a quick sense of your performance, these reports summarize key metrics in a concise format.
Detailed Reports: These offer a more in-depth analysis, allowing you to drill down into specific areas like user behavior, events, or conversions.
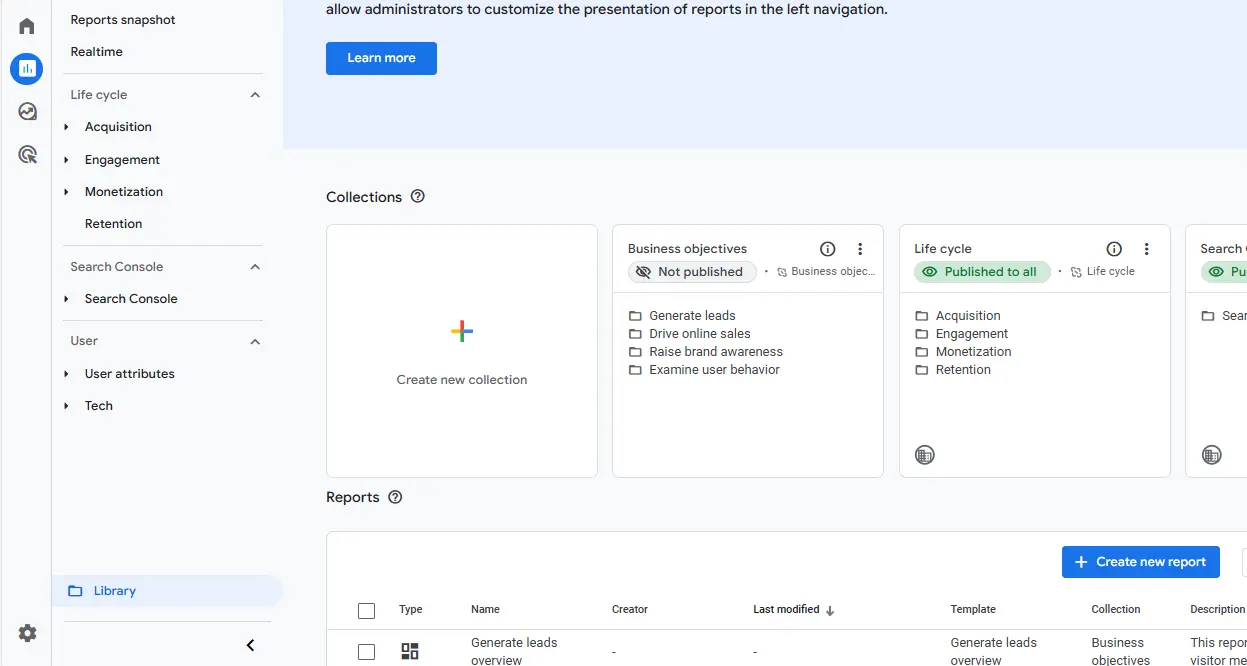
Create and Manage Reports via the Library
The Library feature in GA4 is where the real power of customization comes into play. While editing existing reports is a great start, the Library allows you to go a step further by creating new reports and organizing them into collections that perfectly align with your business goals. This section will guide you through building custom reports from scratch and show you how to organize them into collections for easy access. We’ll also explore why this is incredibly useful, especially for clients who need tailored reporting. For further reading on this part of GA4, see Google’s official documentation on custom reports.
Accessing the Library:
To get started, navigate to the Library at the bottom of the left-hand menu in GA4. Here, you’ll find options to manage all your reports and collections.
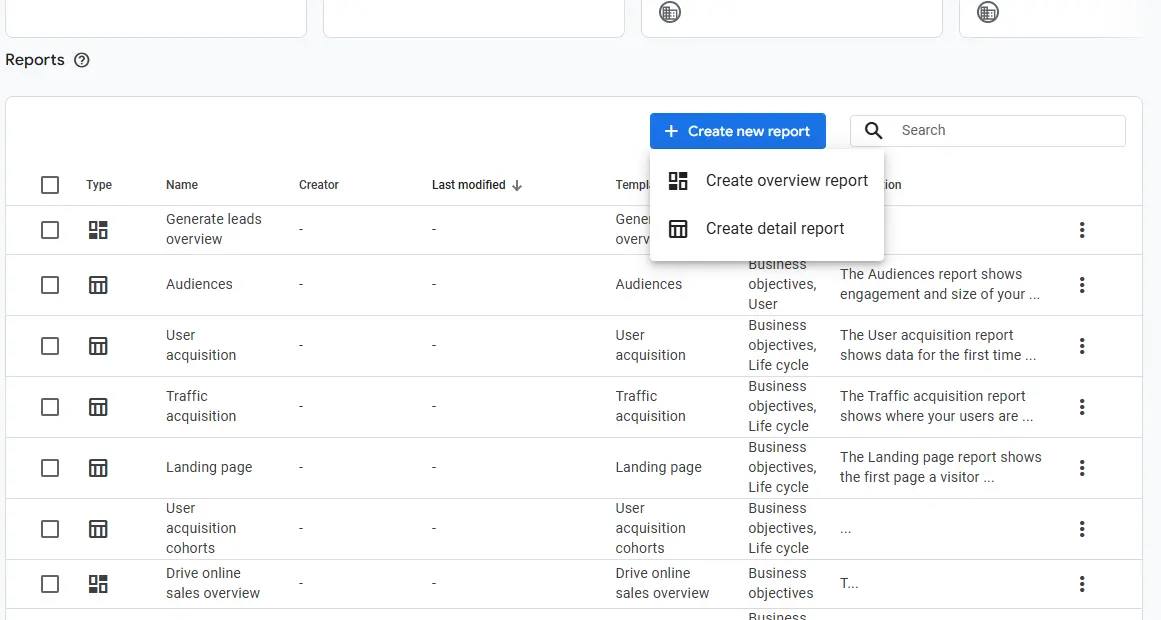
Creating a New Report:
Click the “Create New Report” button. You’ll be prompted to choose a template or start from scratch. Starting from scratch gives you full control over the metrics and dimensions you want to include.
Select the type of report you want to create—whether it’s focused on user behavior, conversions, or any other area of interest. Then, begin building your report by choosing the specific metrics, dimensions, and visualizations that best represent the data you need.
For more information read Google’s official documentation on creating new GA4 overview reports.
Customizing Your Report:
As you build your report, you can add cards, rearrange them, and modify their settings to reflect the exact insights you’re looking for. Whether you want to track the performance of specific pages, monitor conversions for a particular event, or analyze user engagement, you can tailor the report to fit your exact needs. Once you choose the report type, the editing experience is the same as editing the default reports.
Example Use Cases for Custom Reports:
Conversions for Specific Events: Let’s say you’re running a marketing campaign and want to track how well a specific event—like a button click or form submission—is converting. By creating a custom report in GA4, you can focus solely on this event, analyzing its performance across different channels, user segments, and more. This granular view allows you to optimize your campaigns more effectively.
Performance of Specific Pages: Another common use case is monitoring the performance of individual pages or clusters of pages on your site. Whether it’s your homepage, a product page, or a blog post, you can create a report that tracks metrics like page views, bounce rates, and conversions, giving you a clear picture of how each page is performing. This is especially useful for content optimization and SEO efforts.
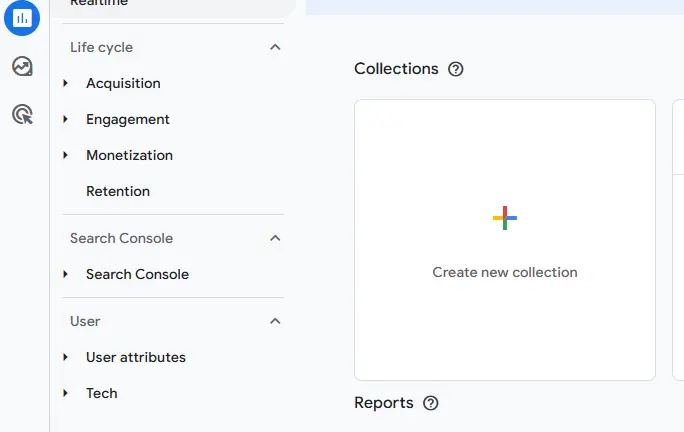
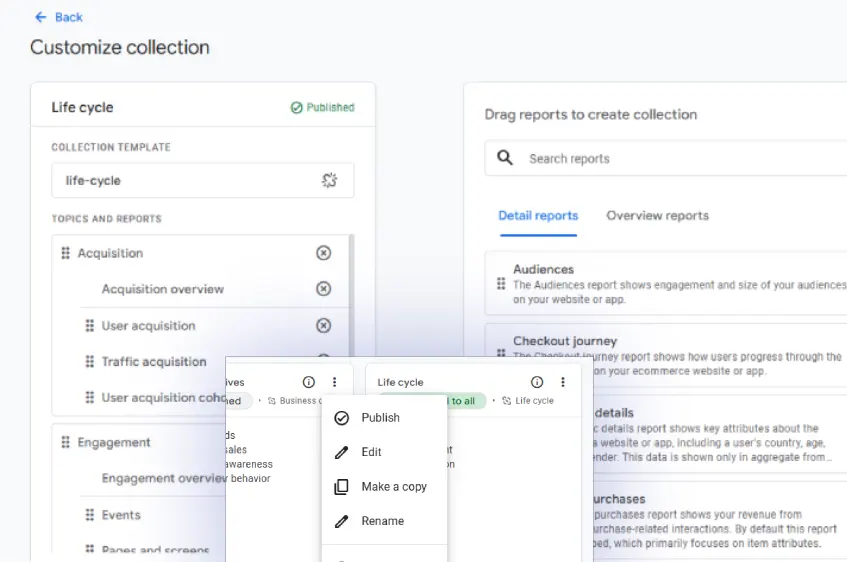
Creating a New Collection:
In the Library, you also have the option to create Collections. Think of a collection as a folder where you can group related reports together. This is particularly useful if you manage multiple aspects of your business or need to organize reports by client, campaign, or department.
Organizing Reports in Collections:
Once you’ve created your reports, you can add them to existing collections or create new ones to keep everything organized. For example, if you have several reports focused on user acquisition, you might group them all under a “User Acquisition” collection. This way, all related reports are easily accessible in one place.
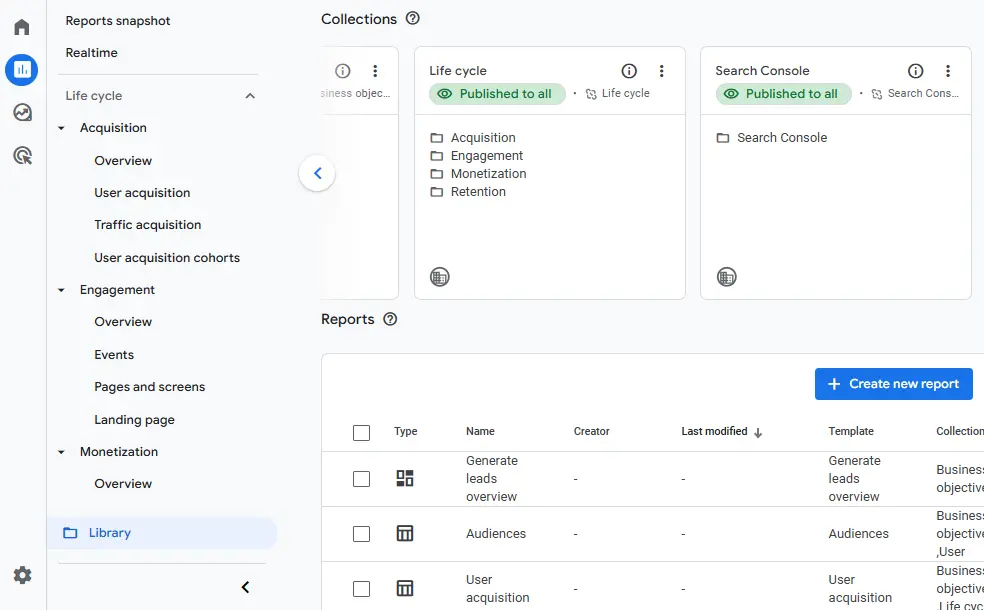
How Collections Appear in the Menu:
After you’ve organized your reports into collections, these collections will appear on the left-hand side menu in GA4. This means that when you log in, you can quickly access all the reports in a collection with just a click. No more applying filters and dealing with secondary dimensions to find what you need – it’s all right there in the main navigation.
Key Features for In-Depth Analysis
GA4 offers several advanced features designed to help you dive deeper into your data and extract more meaningful insights. Whether you’re monitoring real-time activity, capturing quick insights with snapshots, or analyzing customer journeys through lifecycle reports, these tools are essential for getting the most out of GA4. Additionally, understanding how to use the icons next to the pencil icon in reports will further enhance your ability to customize and share data effectively.
Real-Time Reports
Real-time reports in GA4 provide a live view of activity on your website or app, allowing you to monitor user interactions as they happen. This feature is particularly useful for tracking the immediate impact of marketing campaigns, product launches, or any other event where you need to see the results instantly.
Best Practices for Monitoring Live Data:
Monitor Campaigns: Use real-time reports to track the performance of new marketing campaigns. For example, if you’ve just launched an email campaign, you can watch as users click through and engage with your site in real time. This allows you to make quick adjustments if necessary.
Watch for Traffic Spikes: Real-time reports are also valuable for spotting sudden increases in traffic, which could indicate the success of a promotion or the onset of a potential issue, like a site slowdown or outage.
User Segmentation: You can apply segments to real-time reports to focus on specific user groups, such as new visitors, returning users, or those from a particular geographic region. This helps you understand how different audiences are interacting with your site in real time.
Snapshots: Quick Insights
Snapshots are a quick way to capture a specific view of your data at a particular moment. This feature is incredibly useful when you need to save and share a set of insights without having to create a full report. Snapshots can be especially beneficial for meetings or presentations, where you need to showcase specific data points or trends
Creating a Snapshot: To create a snapshot, simply navigate to the report or data view you want to capture and use the snapshot tool. This will save the current view of your data, including any filters or segments you’ve applied.
Using Snapshots: Snapshots can be shared with team members or clients, providing them with a quick, up-to-date look at key metrics. They’re also useful for keeping a record of how certain metrics looked at a specific point in time, which can be helpful for comparing against future data.
For detailed steps on creating snapshots, visit GA4 Snapshot documentation.
Lifecycle Reports: Understanding Customer Journeys
Lifecycle reports in GA4 provide a comprehensive view of the customer journey, from acquisition through engagement, monetization, and retention. These reports are invaluable for understanding how users interact with your business over time and identifying opportunities to improve their experience at each stage. Key Metrics to Focus on in Lifecycle Reports:
Acquisition: Track how users are finding your site, whether through organic search, paid campaigns, social media, or other channels. This helps you identify the most effective acquisition strategies.
Engagement: Monitor how users are interacting with your content, including metrics like page views, session duration, and events triggered. Understanding engagement helps you determine what content resonates with your audience.
Monetization: For e-commerce or subscription-based businesses, monetization reports are key to tracking revenue, average order value, and purchase behavior. This data is critical for optimizing pricing strategies and increasing revenue.
Retention: Finally, retention metrics show how well you’re keeping users engaged over time. High retention rates indicate that users find ongoing value in your product or service, while low retention may signal areas where improvements are needed.
Enhancing Report Customization
When you’re customizing reports in GA4, you’ll notice a set of icons next to the pencil icon that offer additional functionality. Here’s a breakdown of each one:
Edit Comparisons: This icon allows you to add or modify comparisons within your report. Comparisons let you view data side-by-side, such as comparing the behavior of new versus returning users, or traffic from different sources. This feature is useful for understanding differences in user behavior across segments.
Export This Report to Analysis: With this option, you can export the current report to Google Analytics’ Explore feature for deeper analysis. This is particularly helpful if you want to take your data into a more customizable environment to run advanced queries or create complex visualizations.
Share This Report: This icon provides options to share the report with other team members or stakeholders. You can generate a shareable link or export the report in various formats (e.g., PDF, CSV) for easy distribution.
Insights: The Insights icon is a powerful tool that offers automated suggestions and highlights within your report. GA4 analyzes your data and provides insights on trends, anomalies, or areas of interest that you might want to explore further. This feature is particularly useful if you’re looking to uncover hidden opportunities or issues that might not be immediately apparent.
By utilizing these features, you can further enhance your reports, making them more informative, shareable, and actionable.
Best Practices for Dashboard Optimization
Optimizing your GA4 dashboard isn’t just a one-time task; it’s an ongoing process that ensures your analytics setup continues to deliver the insights you need as your business evolves. In this section, we’ll explore best practices for keeping your dashboard up to date, fostering collaboration, and leveraging integrations to enhance your data analysis.
Regular Updates and Maintenance
Importance of Keeping Reports and Dashboards Updated: Your business goals, key performance indicators (KPIs), and market conditions are constantly changing. To stay ahead, it’s crucial that your GA4 reports and dashboards reflect these shifts. Regularly updating your dashboards ensures that the data you’re analyzing is relevant and aligned with your current objectives. An outdated dashboard can lead to misguided decisions based on obsolete information, so make it a habit to review and refresh your reports frequently.
How to Iterate Based on New Business Goals or KPIs:
Review Your KPIs: As your business evolves, so too should your KPIs. Periodically review your goals to determine if the metrics you’re tracking still align with your objectives. For instance, if your focus shifts from acquisition to retention, you’ll want to adjust your reports to highlight user engagement and retention metrics rather than just traffic sources.
Update Report Filters and Segments: As new products, services, or campaigns are launched, it’s important to adjust your filters and segments accordingly. This ensures that your reports accurately reflect the performance of these new initiatives and provide insights that are directly applicable to your current strategies.
Add or Remove Cards and Reports: Based on your updated goals, you may need to add new cards or reports to your dashboard or remove those that are no longer relevant. This keeps your dashboard streamlined and focused on the most critical data.
How to Share Custom Reports with Team Members or Clients:
Collaboration is key to making data-driven decisions that benefit your entire organization. GA4 makes it easy to share custom reports with your team or clients, ensuring that everyone has access to the insights they need.
Generating Shareable Links: GA4 allows you to generate shareable links for your custom reports. These links can be distributed to team members or clients, giving them direct access to the specific reports you’ve created. This is particularly useful for keeping stakeholders informed or for collaborating with remote teams.
Exporting Reports: If you need to present data in meetings or include it in documents, you can export your reports in various formats, such as PDF or CSV. This makes it easy to include your GA4 insights in presentations, proposals, or client deliverables.
Setting Permissions: When sharing reports, it’s important to manage permissions carefully. GA4 allows you to control who can view, edit, or share the reports you’ve created. This ensures that sensitive data is only accessible to those who need it, while still promoting collaboration across your team.
Ensuring Consistency Across Reports and Dashboards:
Standardize Templates and Formats: To maintain consistency across your organization, it’s a good practice to standardize the templates and formats used in your reports. This ensures that all team members are working with the same structure and that reports are easy to compare and analyze across different departments or projects.
Regular Reviews and Audits: Schedule regular reviews or audits of your GA4 dashboards to ensure that they remain consistent and aligned with your overall data strategy. This could involve checking that reports are still relevant, that metrics are being tracked consistently, and that any new reports adhere to established guidelines.
Leveraging GA4 Integrations to Enhance Data Analysis:
GA4 is designed to integrate seamlessly with a variety of other tools and platforms, allowing you to enhance your data analysis capabilities. These integrations can provide a more comprehensive view of your performance by combining data from multiple sources, leading to richer insights and more informed decision-making.
Google Ads Integration: One of the most powerful integrations available in GA4 is with Google Ads. By linking your Google Ads account to GA4, you can gain a holistic view of your ad performance, including how users interact with your site after clicking on an ad. This integration allows you to track conversions, optimize ad spend, and adjust your campaigns based on real-time data.
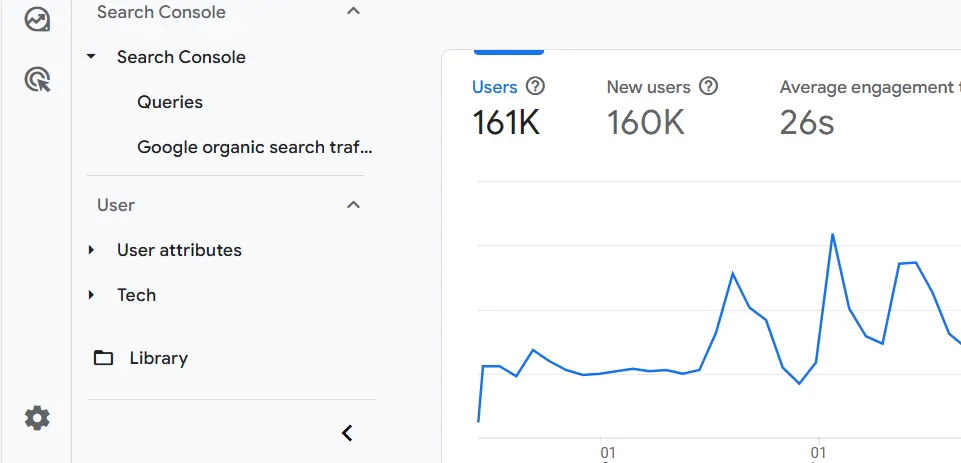
Google Search Console: Integrating GA4 with Google Search Console gives you insights into how your site performs in organic search. This integration helps you track the keywords that drive traffic to your site, monitor your site’s search visibility, and identify areas for SEO improvement.
BigQuery Integration: For businesses with large datasets, integrating GA4 with Google BigQuery allows you to perform advanced analysis and run complex queries on your data. This is particularly useful for businesses that need to analyze data at scale or combine GA4 data with other sources for more in-depth insights.
Example: Integrating with Google Ads for a Holistic View:
Tracking the Full Customer Journey: By integrating GA4 with Google Ads, you can track the entire customer journey from the first ad click to the final conversion. This provides a complete picture of how your ad campaigns are performing and how they contribute to your overall business goals.
Optimizing Ad Spend: With GA4 and Google Ads working together, you can identify which campaigns, keywords, and ads are driving the most valuable traffic to your site. This allows you to allocate your ad budget more effectively, focusing on the strategies that deliver the best return on investment.
Enhanced Reporting: The integration enables you to create detailed reports that combine ad performance data with on-site behavior metrics. This helps you understand not just which ads are driving traffic, but also how those users are engaging with your site, leading to more informed decisions about your marketing strategies.
Maximizing the Value of GA4
By following these tips and leveraging the full suite of tools available in GA4, you’ll be well-equipped to turn data into meaningful, actionable insights that drive your business forward. Keep refining, keep experimenting, and continue to make GA4 an integral part of your decision-making process.
If you’d like assistance, Market Vantage offers a GA4 setup service – learn more here. Remember, the GA4 dashboard is your compass—use it to explore, measure, and improve your online presence, and you’ll ensure your business is heading in the right direction.